The other day, one of the end users I support came to me with a sample portfolio report that had been generated manually within Visio. The question he asked me was whether or not it was feasible to generate something like that out of Project Server data. Upon review, it certainly looked doable, and it looked conceptually similar to a this post on generating single project timelines in Visio.
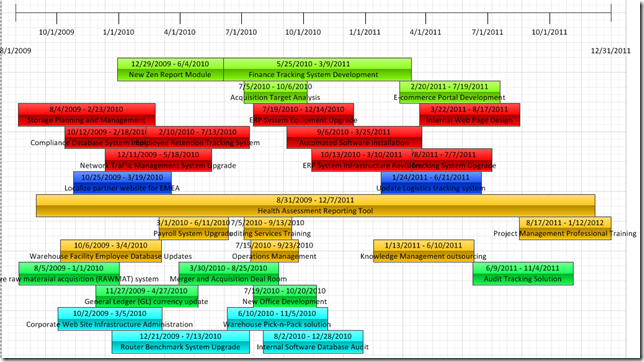
Seeing as I hadn’t played around with Visio in a while, I figured it was worth a shot. Here’s what the final result looked like…
First off, my standard caveat. I am not a Visio expert, nor do I purport to pretend that I know much about the tool. I can figure out how to do the basic functions that I need it to do, and this case is no different. I would certainly welcome any and all feedback from a “real” Visio power user on the instructions below. Even if these instructions end up being wrong, I suppose they make a good starting point for an interesting discussion on the topic.
Another caveat, and a question to the SSRS developers out there….would this be any easier to knock together in SSRS?
…now back to our regularly scheduled program.
Create the Basic Timeline Report
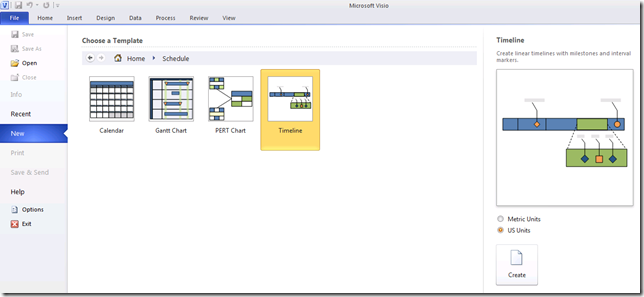
We’ll start by creating a simple timeline in Visio.
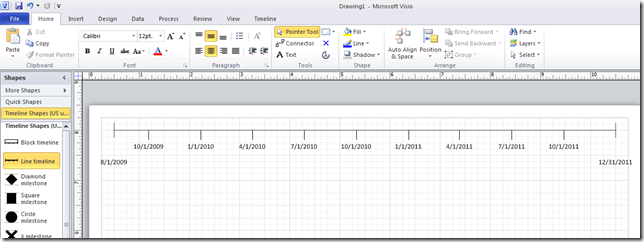
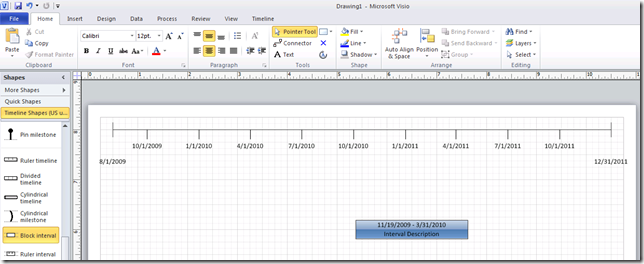
Add the ruler timeline to the top of the page (or the bottom, I suppose – although you may have to modify these instructions accordingly). Set the ruler to display the appropriate timeline for your project portfolio.
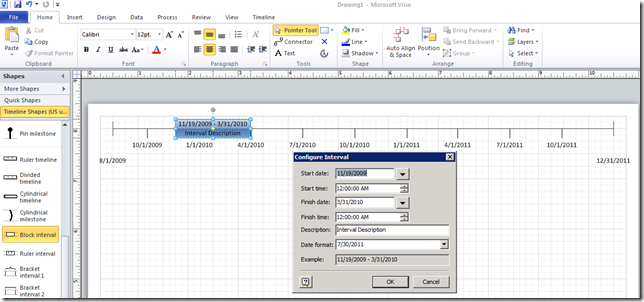
Now add a block interval, which is usually used to represent a single activity or phase. Let’s use this block interval to review the default timesheet behavior.
You’ll see that you can change the start and end date of the interval to automatically change the width of the shape as well as the location along the X axis…..provided that you don’t actually grab the shape and drag it off of the timeline. Once you do that, you’ve broken the connection to the timeline, and changing dates will not control the X axis.
Go ahead, try pulling it off of the timeline and change the dates. See how the connection has been broken?
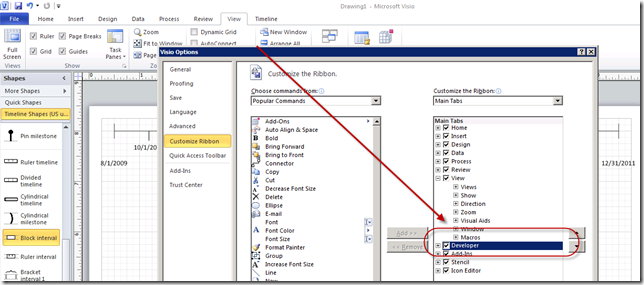
Now delete the block interval we’ve just created, and let’s add a new one back onto the timeline. Let’s take a look at the Shape Sheet for this interval. To get the Shape Sheet to appear in Visio 2010, you’ll need to right click on the Ribbon, customize it, and then add the Developer tab.
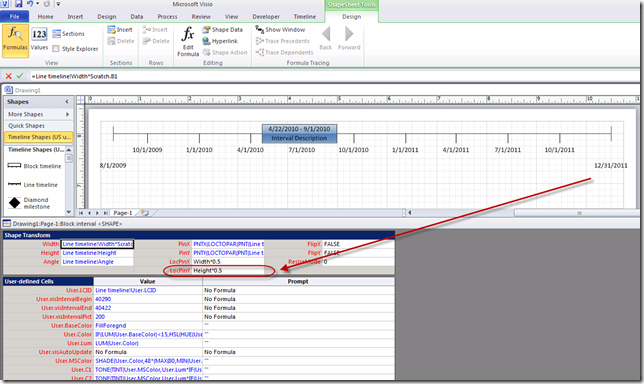
Once you have the Developer tab displayed, look at the Shape Sheet for the new block interval. It should look as follows:
Note the LocPinY field. By default, it shows as “Height*0.5,” which represents a Y coordinate relative to the location of the timeline.
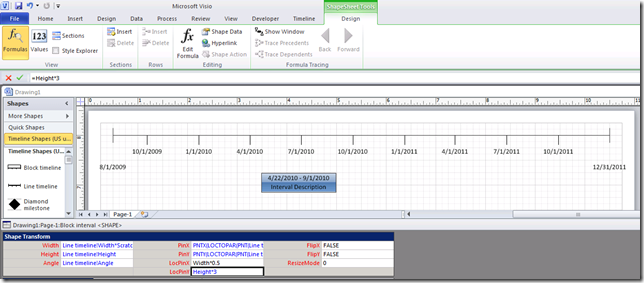
Modify that formula to see how the interval moves up and down on the sheet. In the following example I’ve changed the formula to “Height*3.” Positive numbers move the interval down. Negative values move the interval up over the timeline.
So now we’ve identified that we can control the position and width of the interval by modifying the values of three fields: Start, Finish, and LocPinY.
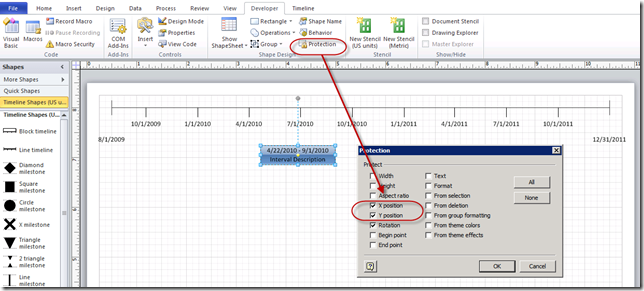
We’ve also identified, and feel free to check this on your own, that the minute you select the interval and move it around on the sheet, you’ve broken the synchronization with the timeline. To prevent yourself from inadvertently breaking that synchronization, you can select the interval, and then the Protection option from the Developer tab. Lock down the X and Y axes.
The only way that the interval may be changed now is by changing those three fields identified above. This also means that the interval will always remain in sync with the timeline at the top of the page.
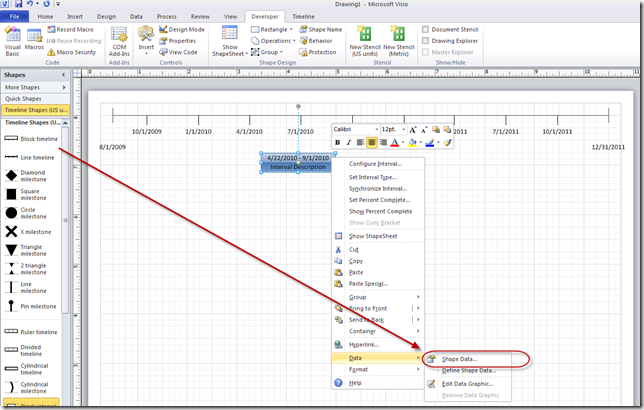
One more thing to play with while we’re reviewing the behavior of this sheet. Right click on the interval and display the Shape Data.
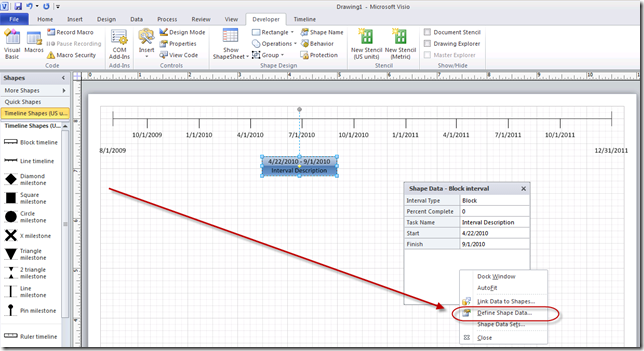
Right click on the resulting Shape Data window and choose the option to Define Shape Data.
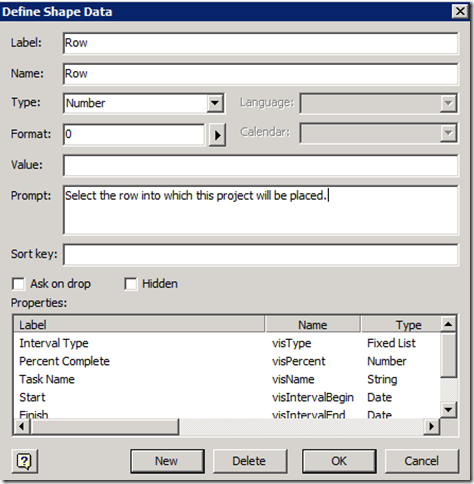
Create a new whole number field. I am calling this “Row,” but feel free to use whatever term you would like.
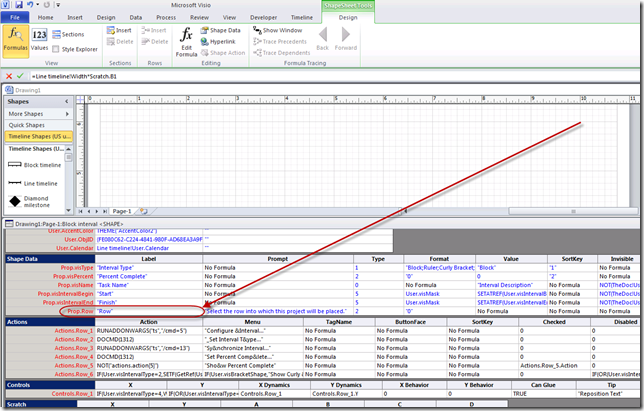
Go back into the Shape Sheet and scroll down until you see Data section. You should be able to find the newly created field in that section – although whether or not the name is automatically updated appears to depend on the version of Visio that you’re using.
In this case, you’ll see that Visio refers to the field as “Prop.Row.” Go back up the Shape Sheet to the LocPinY field and modify the formula so that it now displays “Height*Prop.Row.”
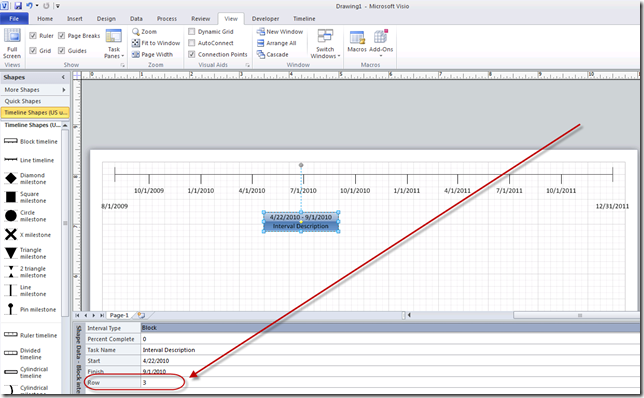
Now, whenever you edit the shape data field, the interval will shift along the Y axis. As this is all being done through manipulation of field data, the interval will remain safely in sync with the timeline at the top of the page.
To make things easier later on, I’d recommend leaving a value of 3 in the custom Row field. That will help us format the report when we add all of our projects.
Oh yeah….lest I forget, I do have one more thing. Going back to the original request from my end user, the desired report would color code projects based on a specific parameter such as phase, or status, or in this case, department.
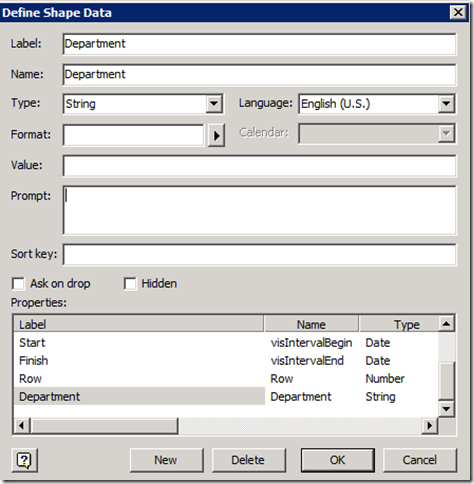
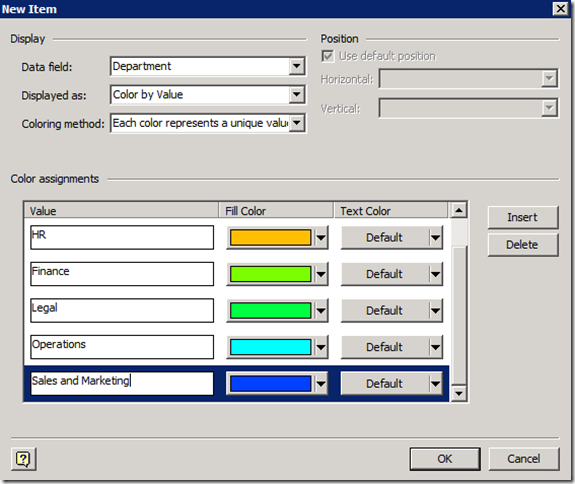
Based on the instructions above, add a second field to the Shape Data called “Department.”
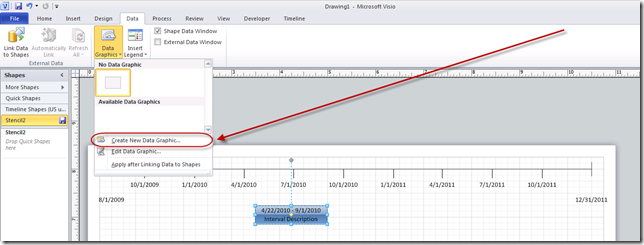
Click OK. Now select the interval, and under the Data tab, select the option to define a new Data Graphic.
Configure the data graphic to change the color of the shape based on the value entered in the Department field.
Starting to feel good to stretch those long disused Visio muscles. Next up, saving the modified shape as a stencil…

[…] the previous two posts, please see Part 1 and Part […]
[…] Enterprise Project Management with a Microsoft Focus Skip to content HomeAbout ← Creating a Portfolio Timeline Report in Visio (Part 1) Creating a Portfolio Timeline Report in Visio (Part 3) […]
[…] within a specific portfolio of projects. Building off of this post I did a couple of weeks ago on developing a portfolio timeline, here’s a quick and easy report to display key milestones in […]
[…] now there’s hope. BI eye candy can be yours as well. In previous posts, I discussed a portfolio timeline report and a stage gate report. In this post, I’d like to introduce a cumulative milestone […]
[…] Portfolio Timeline Report (Visio) […]
[…] Creating a Portfolio Timeline Report in Visio (Part I) […]
Andrew,
very much enjoyed your session on BI at Project Conference. I am a BI fan myself, and you taught me a few things I did not know. Looking forward to your session tomorrow as well.
-Dan, ms project now.
Thanks!
[…] data in SharePoint. In fact, I’ve even blogged it before (here for standalone projects, and here for portfolio […]
Thank you for taking the time to post this. I’ve used this information and created some great timelines. Many thanks!
Thank you for the helpful article. I did a little tweak to the row settings: I have added 1 as default value in the shape data, and in the ‘LocPinY’ shapesheet cell I’ve changed the formula to ‘Height*(Prop.Row+2)’. I believe this makes it more user friendly, because users can simply use a number from 1 to xx for the row.
This is an interesting approach. At Plansis we developed another one using Reporting Services.
Check here for SSRS
http://www.prasannaadavi.com/2012/05/creating-portfolio-timeline-using-ssrs.html