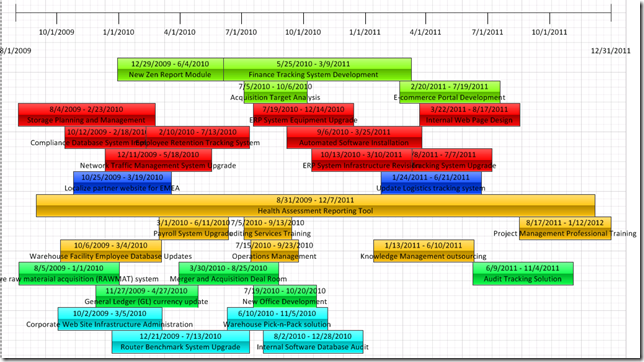
This is the second post in a short series on how to create a simple timeline view of multiple projects in Visio. The goal is to produce a report that appears as below, and that is dynamically updated from Project Server data.
In the first post, we reviewed the Visio Timeline behavior and identified the modifications we’ll need to make to support this effort. In this post, we’ll take those modifications and turn them into a shape stencil.
Create a New Custom Shape
Now that we have identified the default timeline behavior as well as the modifications that we will need to make, let’s go ahead and create our report. As discussed in the previous post, go ahead and create a new timeline report. Add the timeline to the top of the page, and configure the date range appropriately.
(In fact, to make life easier for you, I’ll just offer the same template that I developed when writing this post. Go ahead and download it here. If you decide to use that, go ahead and skip ahead to the section on Adding External Data.)
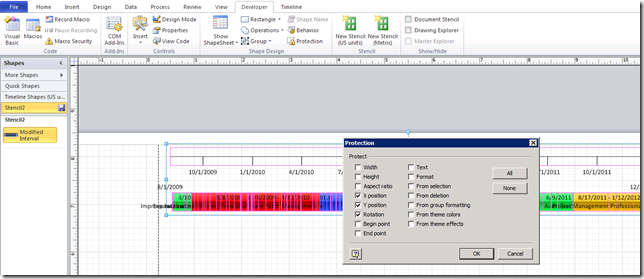
If you want to make your own template, then go ahead and make the modifications to the shape as identified in the previous post – with one crucial difference. Don’t lock down the X or Y axes using protection. If you’re using the same file from the previous exercise, go back to the Developer tab, select Protection, and uncheck those options.
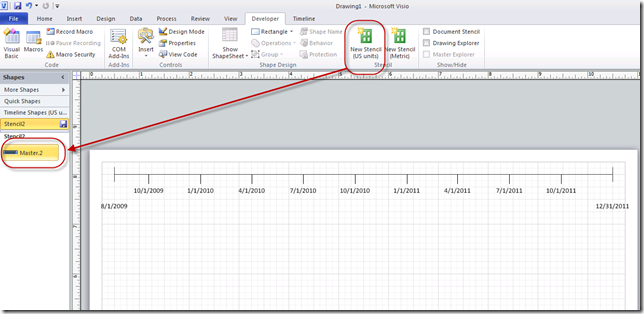
Next click on the option to create a New Stencil, then drag the modified interval onto the Shapes window.
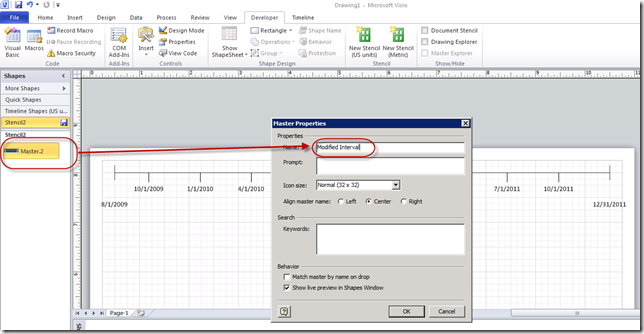
Right click on the new stencil to change the name to something more descriptive.
Add External Data
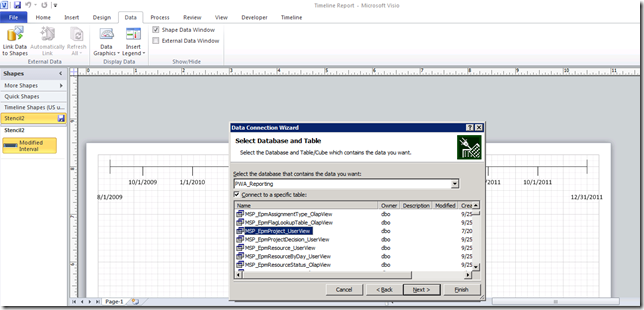
The next step is pretty simple. Click on the Data tab and select the option to Link Data to Shapes. That kicks off the wizard to link the report to SQL. Select the PWA Reporting database and the appropriate table. In this case, I will be using the EPMProject_UserView table for my data source.
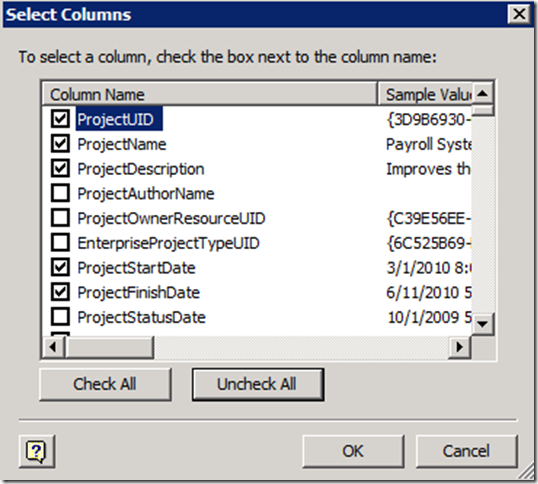
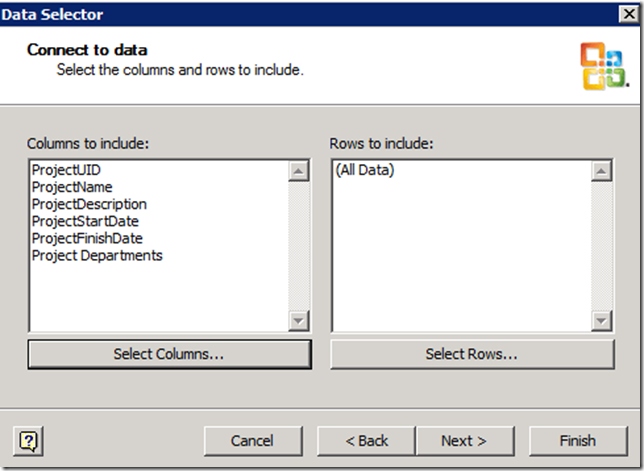
Continue through the default options for the wizard until you get to the point where you have to select the columns and rows to be imported. I will select the Project ID, Name, Description, Start, Finish, and Project Departments fields. You may also select other fields that will be displayed whenever the item is selected within Visio.
Add a filter on the rows if that is required.
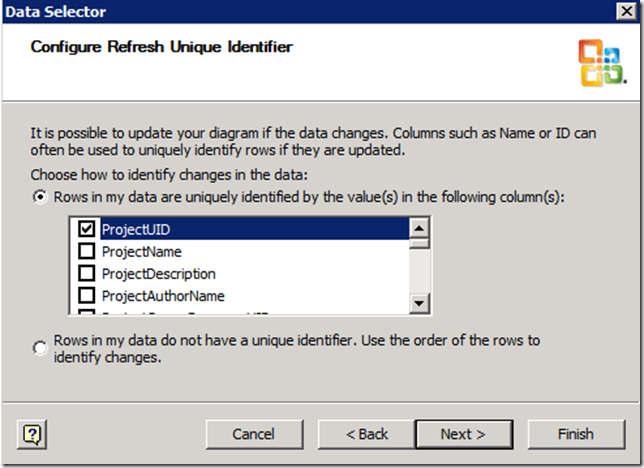
Keep going until you get to the screen where the primary key is defined. Make sure the Project UID option is selected. This will allow the items to be dynamically updated from SQL data.
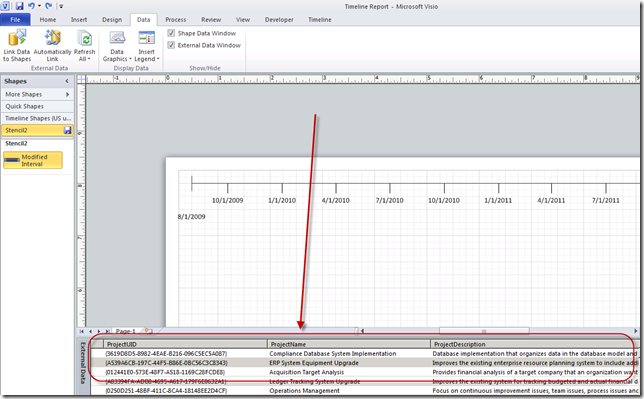
The data now appears in the External Data window within Visio.
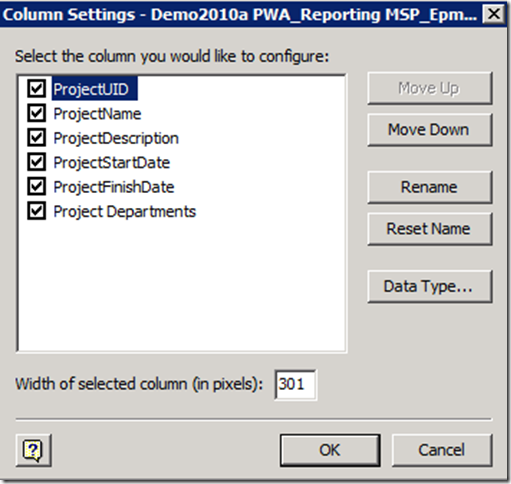
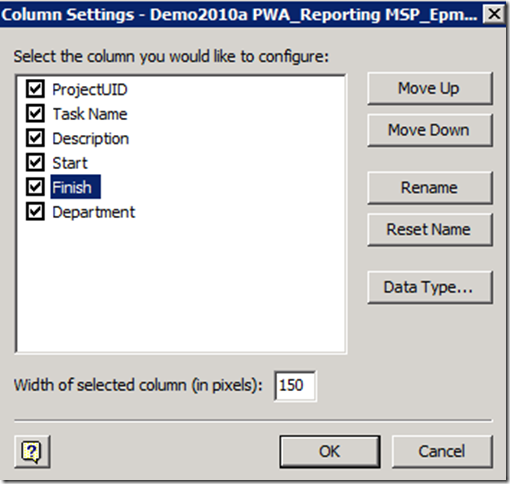
Now we have to map the fields from SQL to the fields identified in the Shape Data. Right click on the External Data Window and choose the Column Settings option.
Rename the fields so that they correspond to the Shape Data field names. In the case of Project Description, I simply renamed it to something a bit more user friendly.
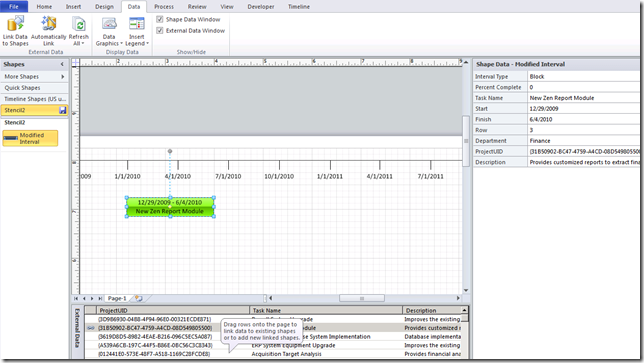
Back in the Visio drawing, select the stencil on the left. Select one of the projects in the External Data window, and drag it onto the main screen. The project record will default to the stencil that you have selected. (Note that you just need to drag the project to the main screen and not onto the timeline. If you drag the project record onto the timeline, it will revert to the timeline shape and not the customized interval shape.)
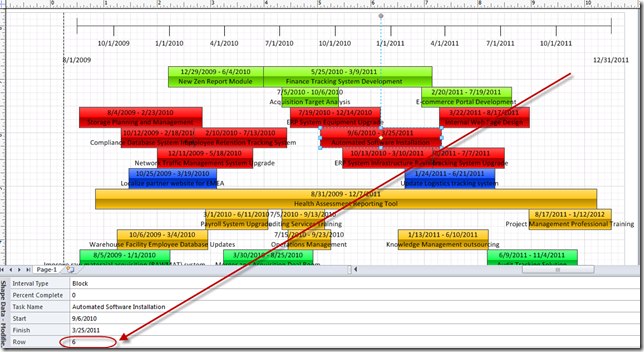
Confirm that the Shape Data translated correctly and that the correct color is displayed on the interval. Change the value in the Row field to move the shape up or down.
Look good? Start grabbing projects and dragging them onto the screen. At this point I ran into either a feature or bug in Visio that caused me a little concern. Whenever I grabbed multiple projects and dragged them to the screen, the Shape Sheet height formula would default back to the original formula. When I drag them onto the screen one by one, the correct formula would be applied, and I could modify the location on the sheet with the Row field.
Moral of the story. Drag each project onto the screen one by one. It’s a bit onerous, but you only have to do this once, as afterwards the data will get automatically refreshed anyways. The result will probably look something like this.
To preclude inadvertently breaking the sync with the timeline, select everything on the drawing, and add X and Y axis protection from the Developer tab.
From there, it’s a simple matter of displaying the Shape Data window, and manually modifying the Row field to get the report formatted appropriately.
Feel free to edit the dates on the projects to improve readability or perhaps to do some what-if analysis on the portfolio. Once you’ve updated any of the data fields, you only have to click Refresh on the Data tab to pull the latest data from Project Server. That gives you the option of configuring the refresh process.
The first time you do so, you may wish to check the option to overwrite your changes with the Project Server data.
Next up….publishing the report into SharePoint and a brief discussion of issues with the timeline template and the Visio Web Service.


![image_thumb5[1] image_thumb5[1]](https://azlav.wordpress.com/wp-content/uploads/2011/07/image_thumb51_thumb.png?w=644&h=400)
[…] Project Epistemology Enterprise Project Management with a Microsoft Focus Skip to content HomeAbout ← Creating a Portfolio Timeline Report in Visio (Part 2) […]
Hello Andrew,
I was thinking of using the teamplate you developed for one of my project, but the link is not working. Could you please email me the template.
I really liked the site and the detail explanation you have given on each subject with the screen shot. I am going to use this site to build my knowledge.
Thanks a lot,
Sushe
Hi Andrew,
I am trying to create a project timeline (like the one you have) in visio and wanted to use the template which you mentioned above, but the link is not working. Could you please email me the template.
Thanks,
Sushe
Try this link for the Visio timeline template: https://skydrive.live.com/redir?resid=EEF5281507DE1CE8!204&authkey=!AG8zQ5HEhj57Ftg
Thank you Andrew. I triend the above link and it is not working. Does the browser matter to download the file?
Hi Andrew,
I used your timeline template (very successfully and LOVE it!), but need to do an expanded timeline because it’s so large. I created new stencils for both the block interval and the diamond milestone, but those custom shapes won’t transfer into the expanded timeline. Is there a way to fix this?
You might need to copy the existing stencils for that to work. There’s some underlying code in Visio that marries them to the timeline.
Yes. I’m actually using the same Visio file, so the stencils are there. I need to show an expanded piece of the timeline and in looking at the code, it looks like even though I used “Modified interval” and “Modified milestone” stencils, Visio still sees them as “block” and “diamond”. Not sure where to fix that or if it’s even possible. ?